
|
|
Blue Noise through Optimal Transport |
| Fernando de Goes |
Katherine Breeden |
Victor Ostromoukhov |
Mathieu Desbrun |
| Caltech | Stanford | Lyon 1 U./CNRS-LIRIS | Caltech |
|
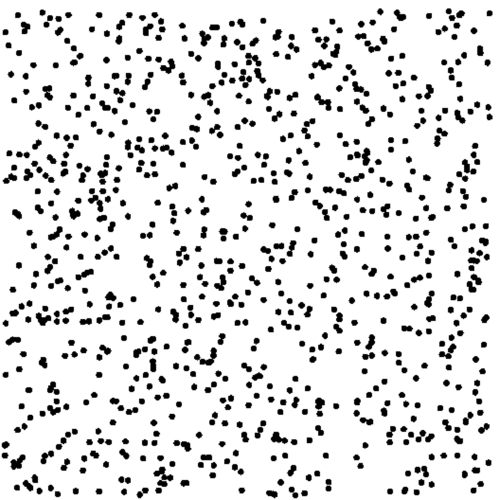
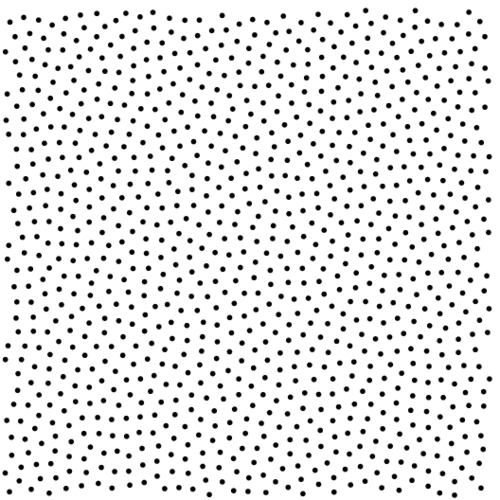
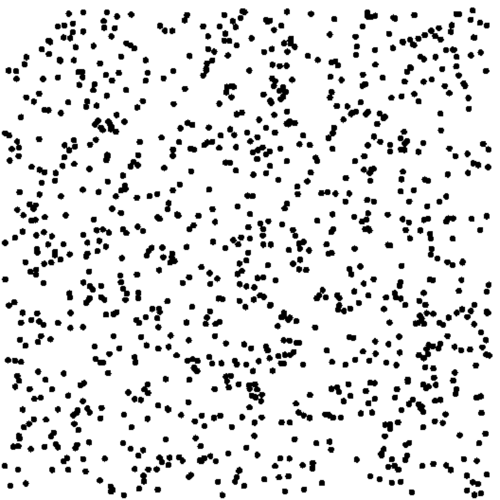
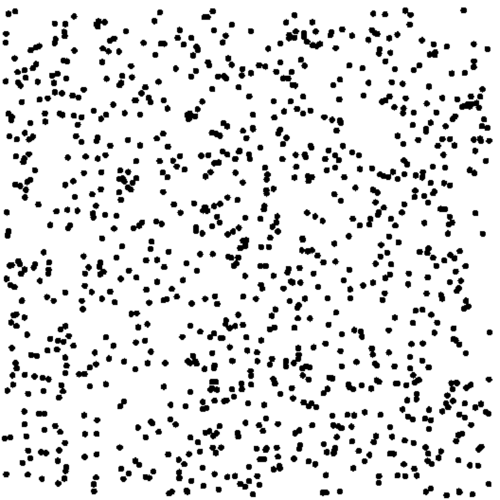
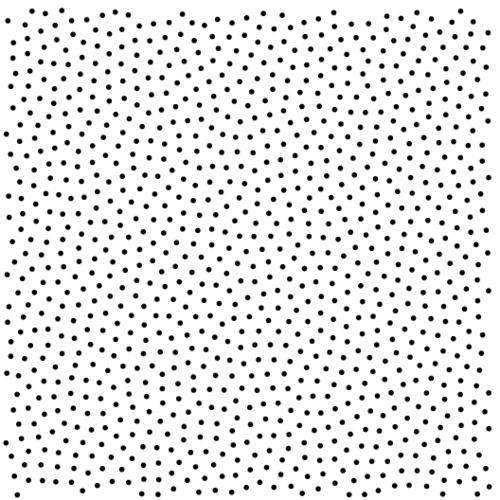
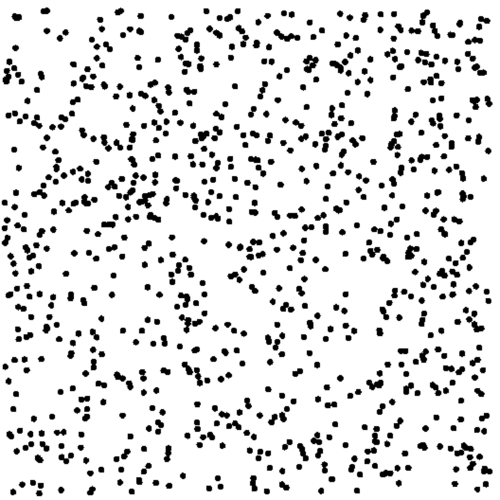
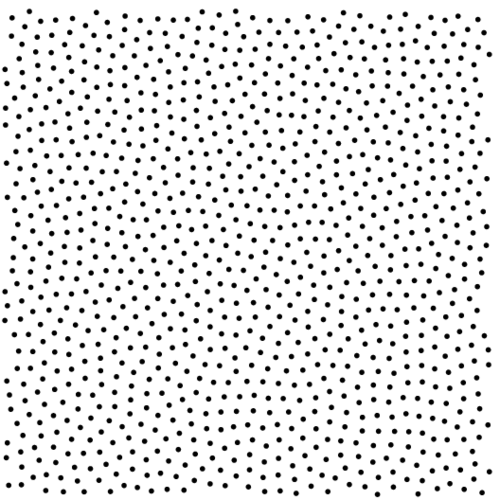
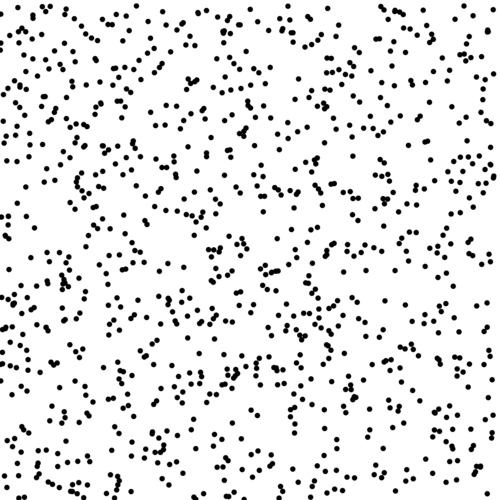
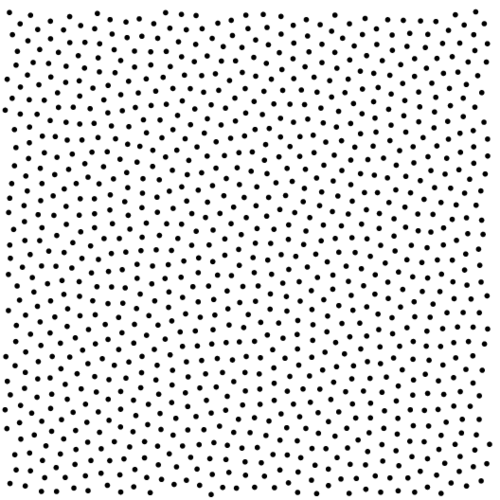
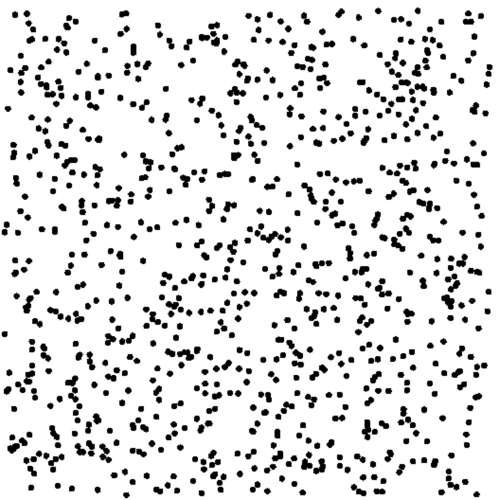
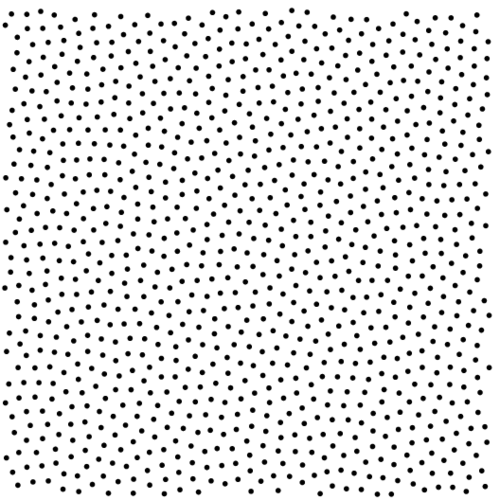
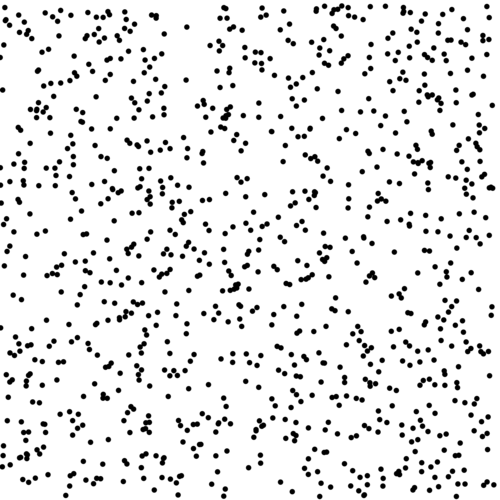
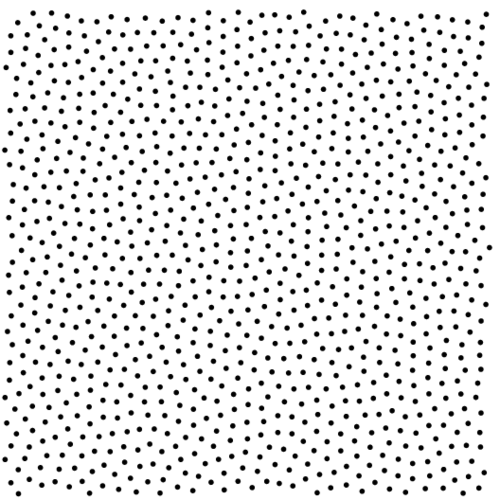
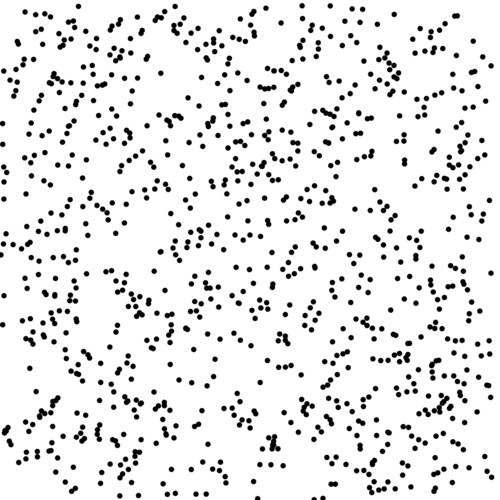
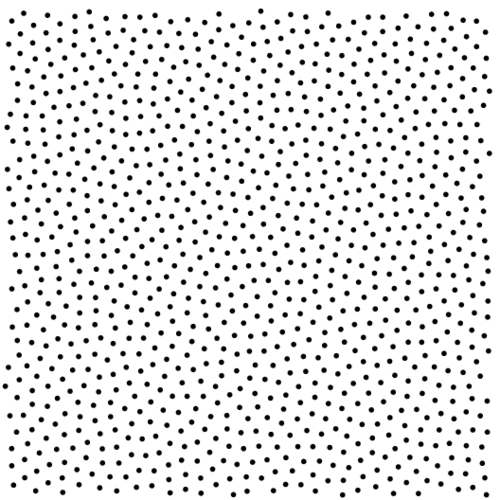
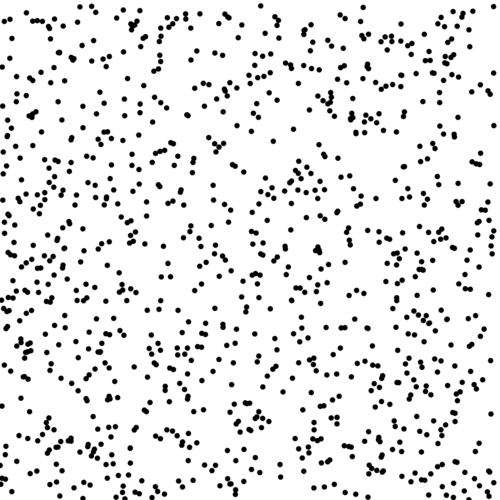
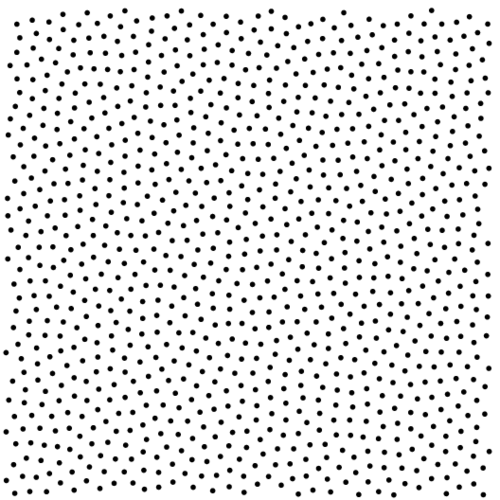
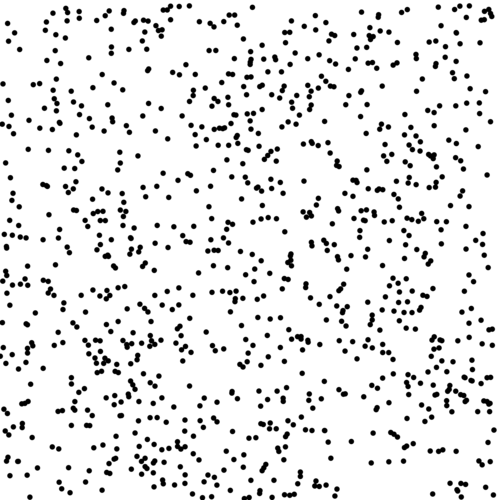
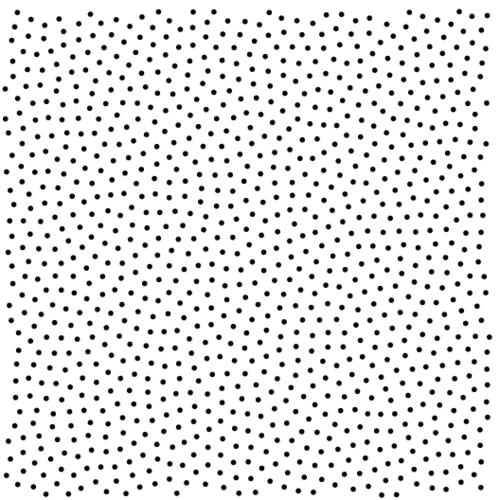
Here you can find 10 point sets generated for
a constant density function in a periodic domain, and various
illustrations based on spatial and spectral analyses to evaluate
our results. We also provide the initial point sets used as
input to our algorithm. Click on the images to see enlarged
versions
|
 (a) |
 (b) |
  (c) |
 (d) |
 (e) |
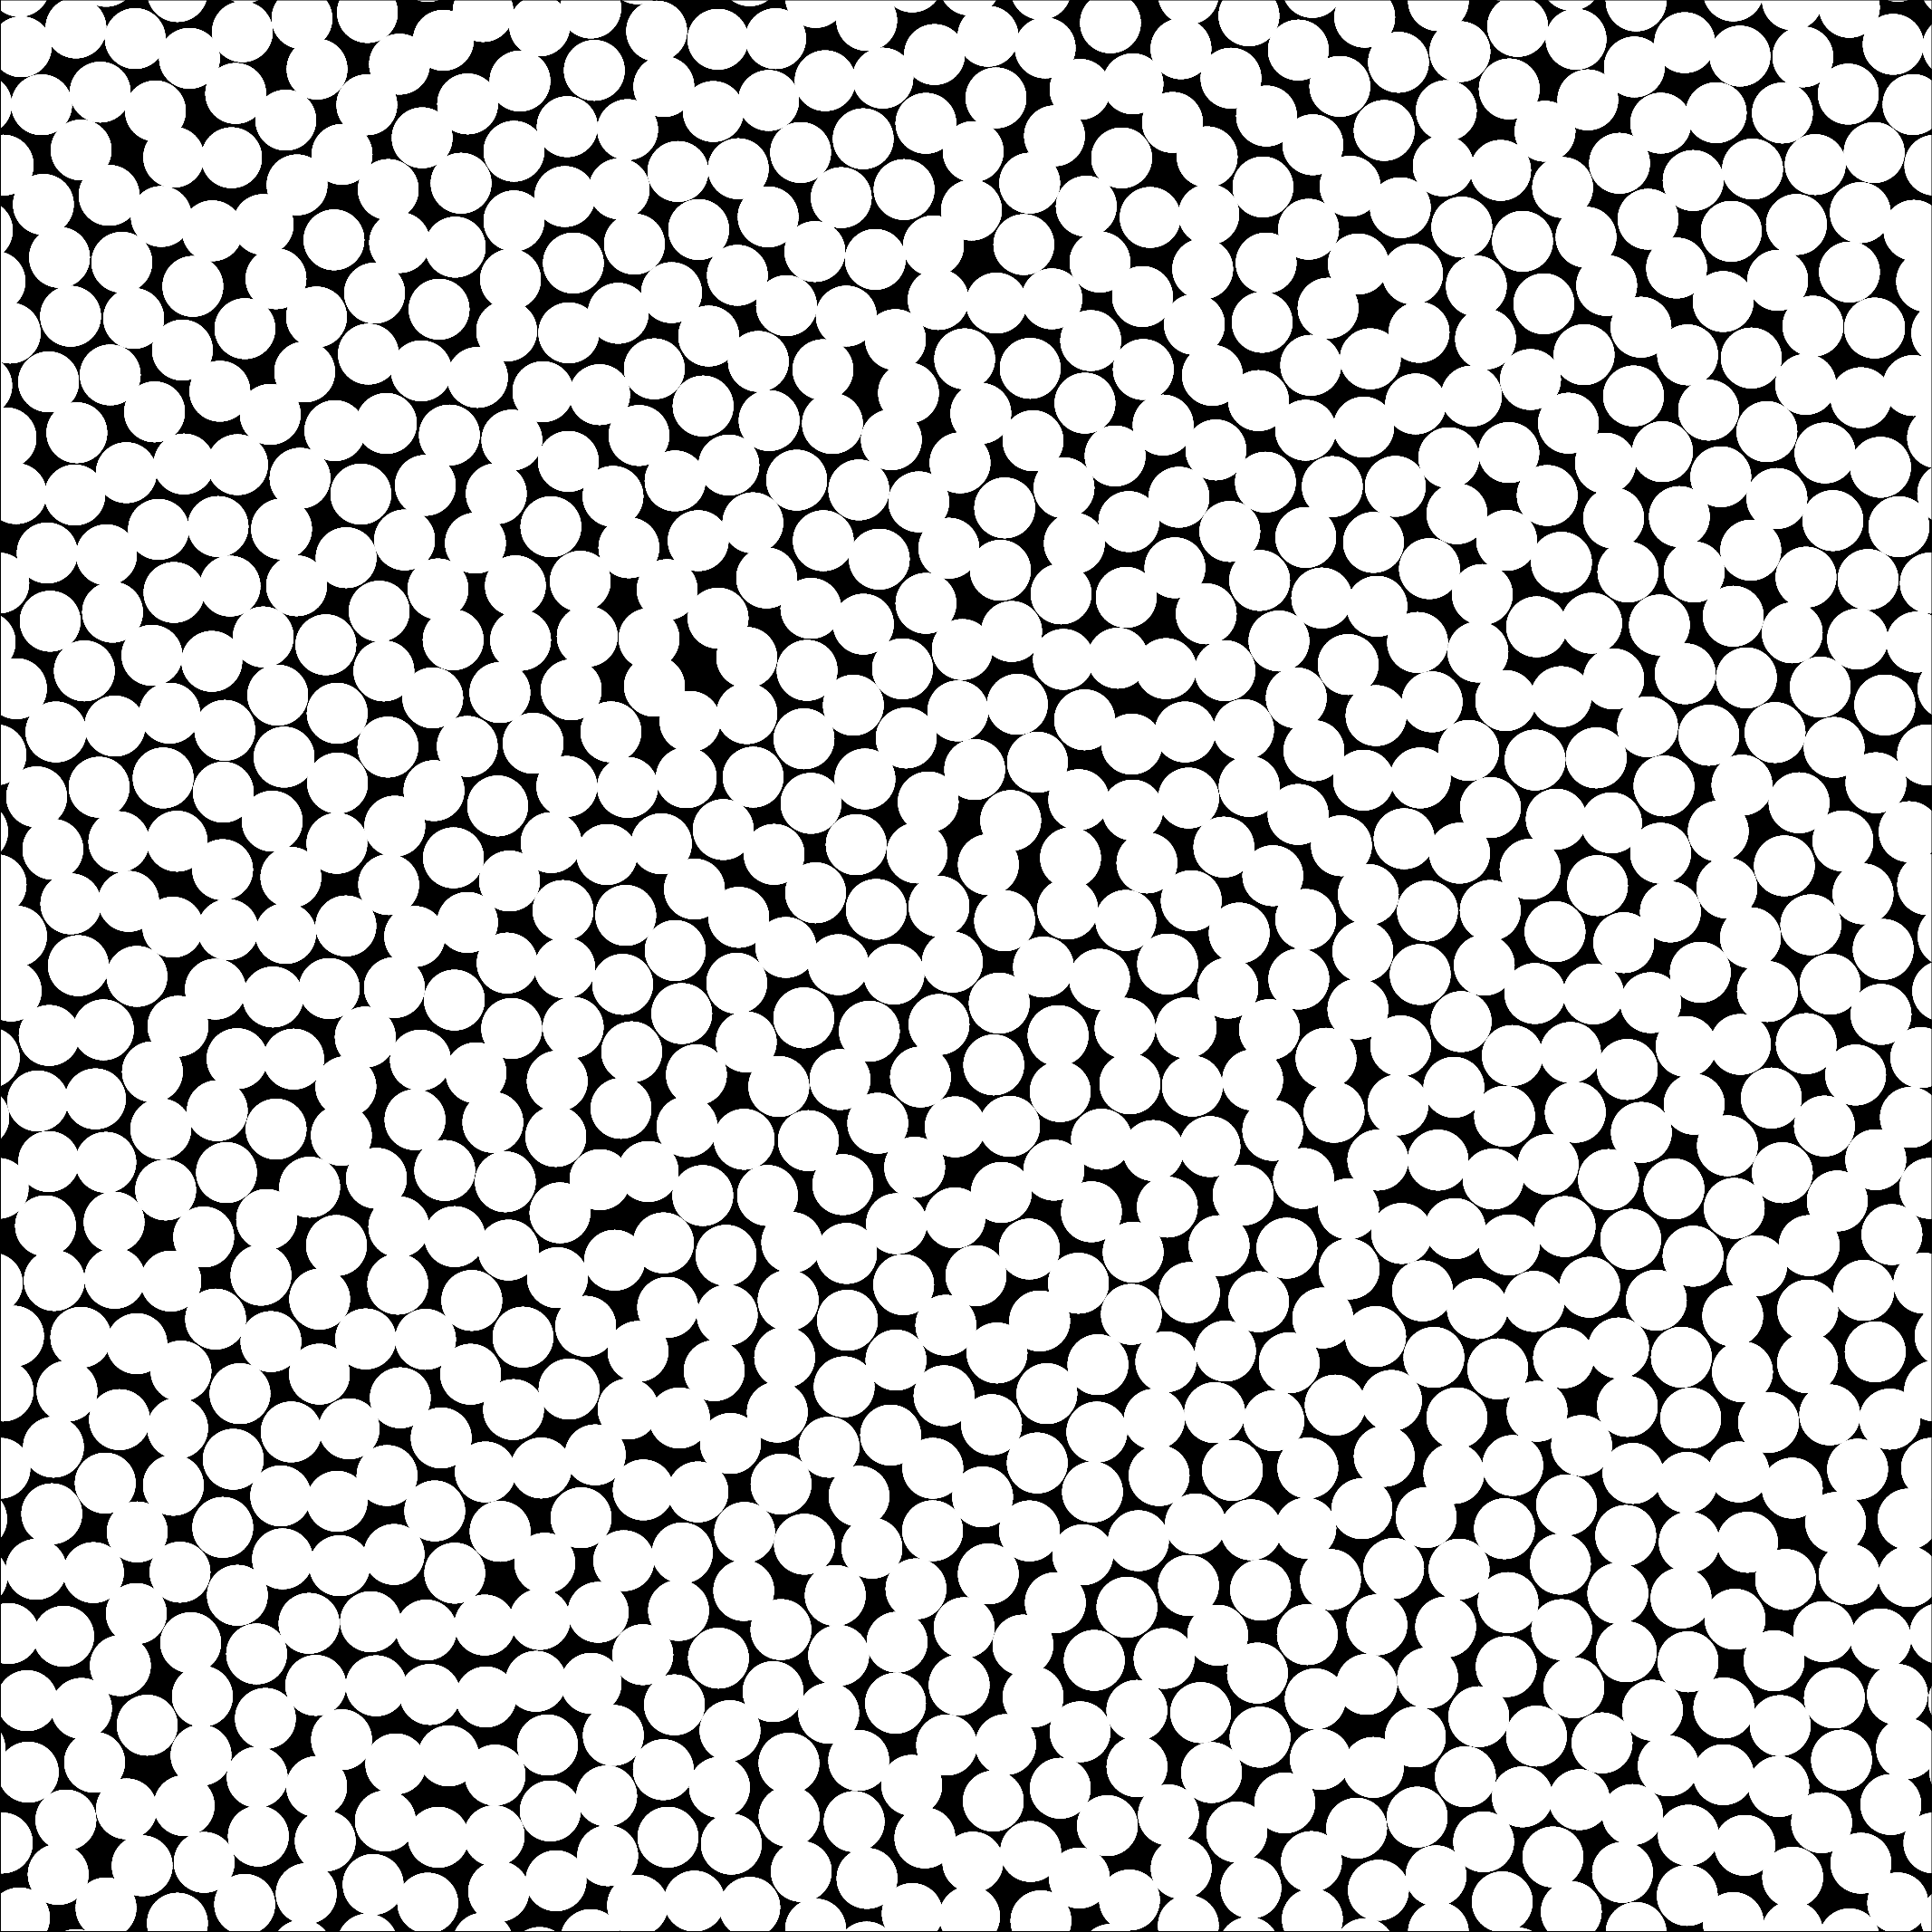
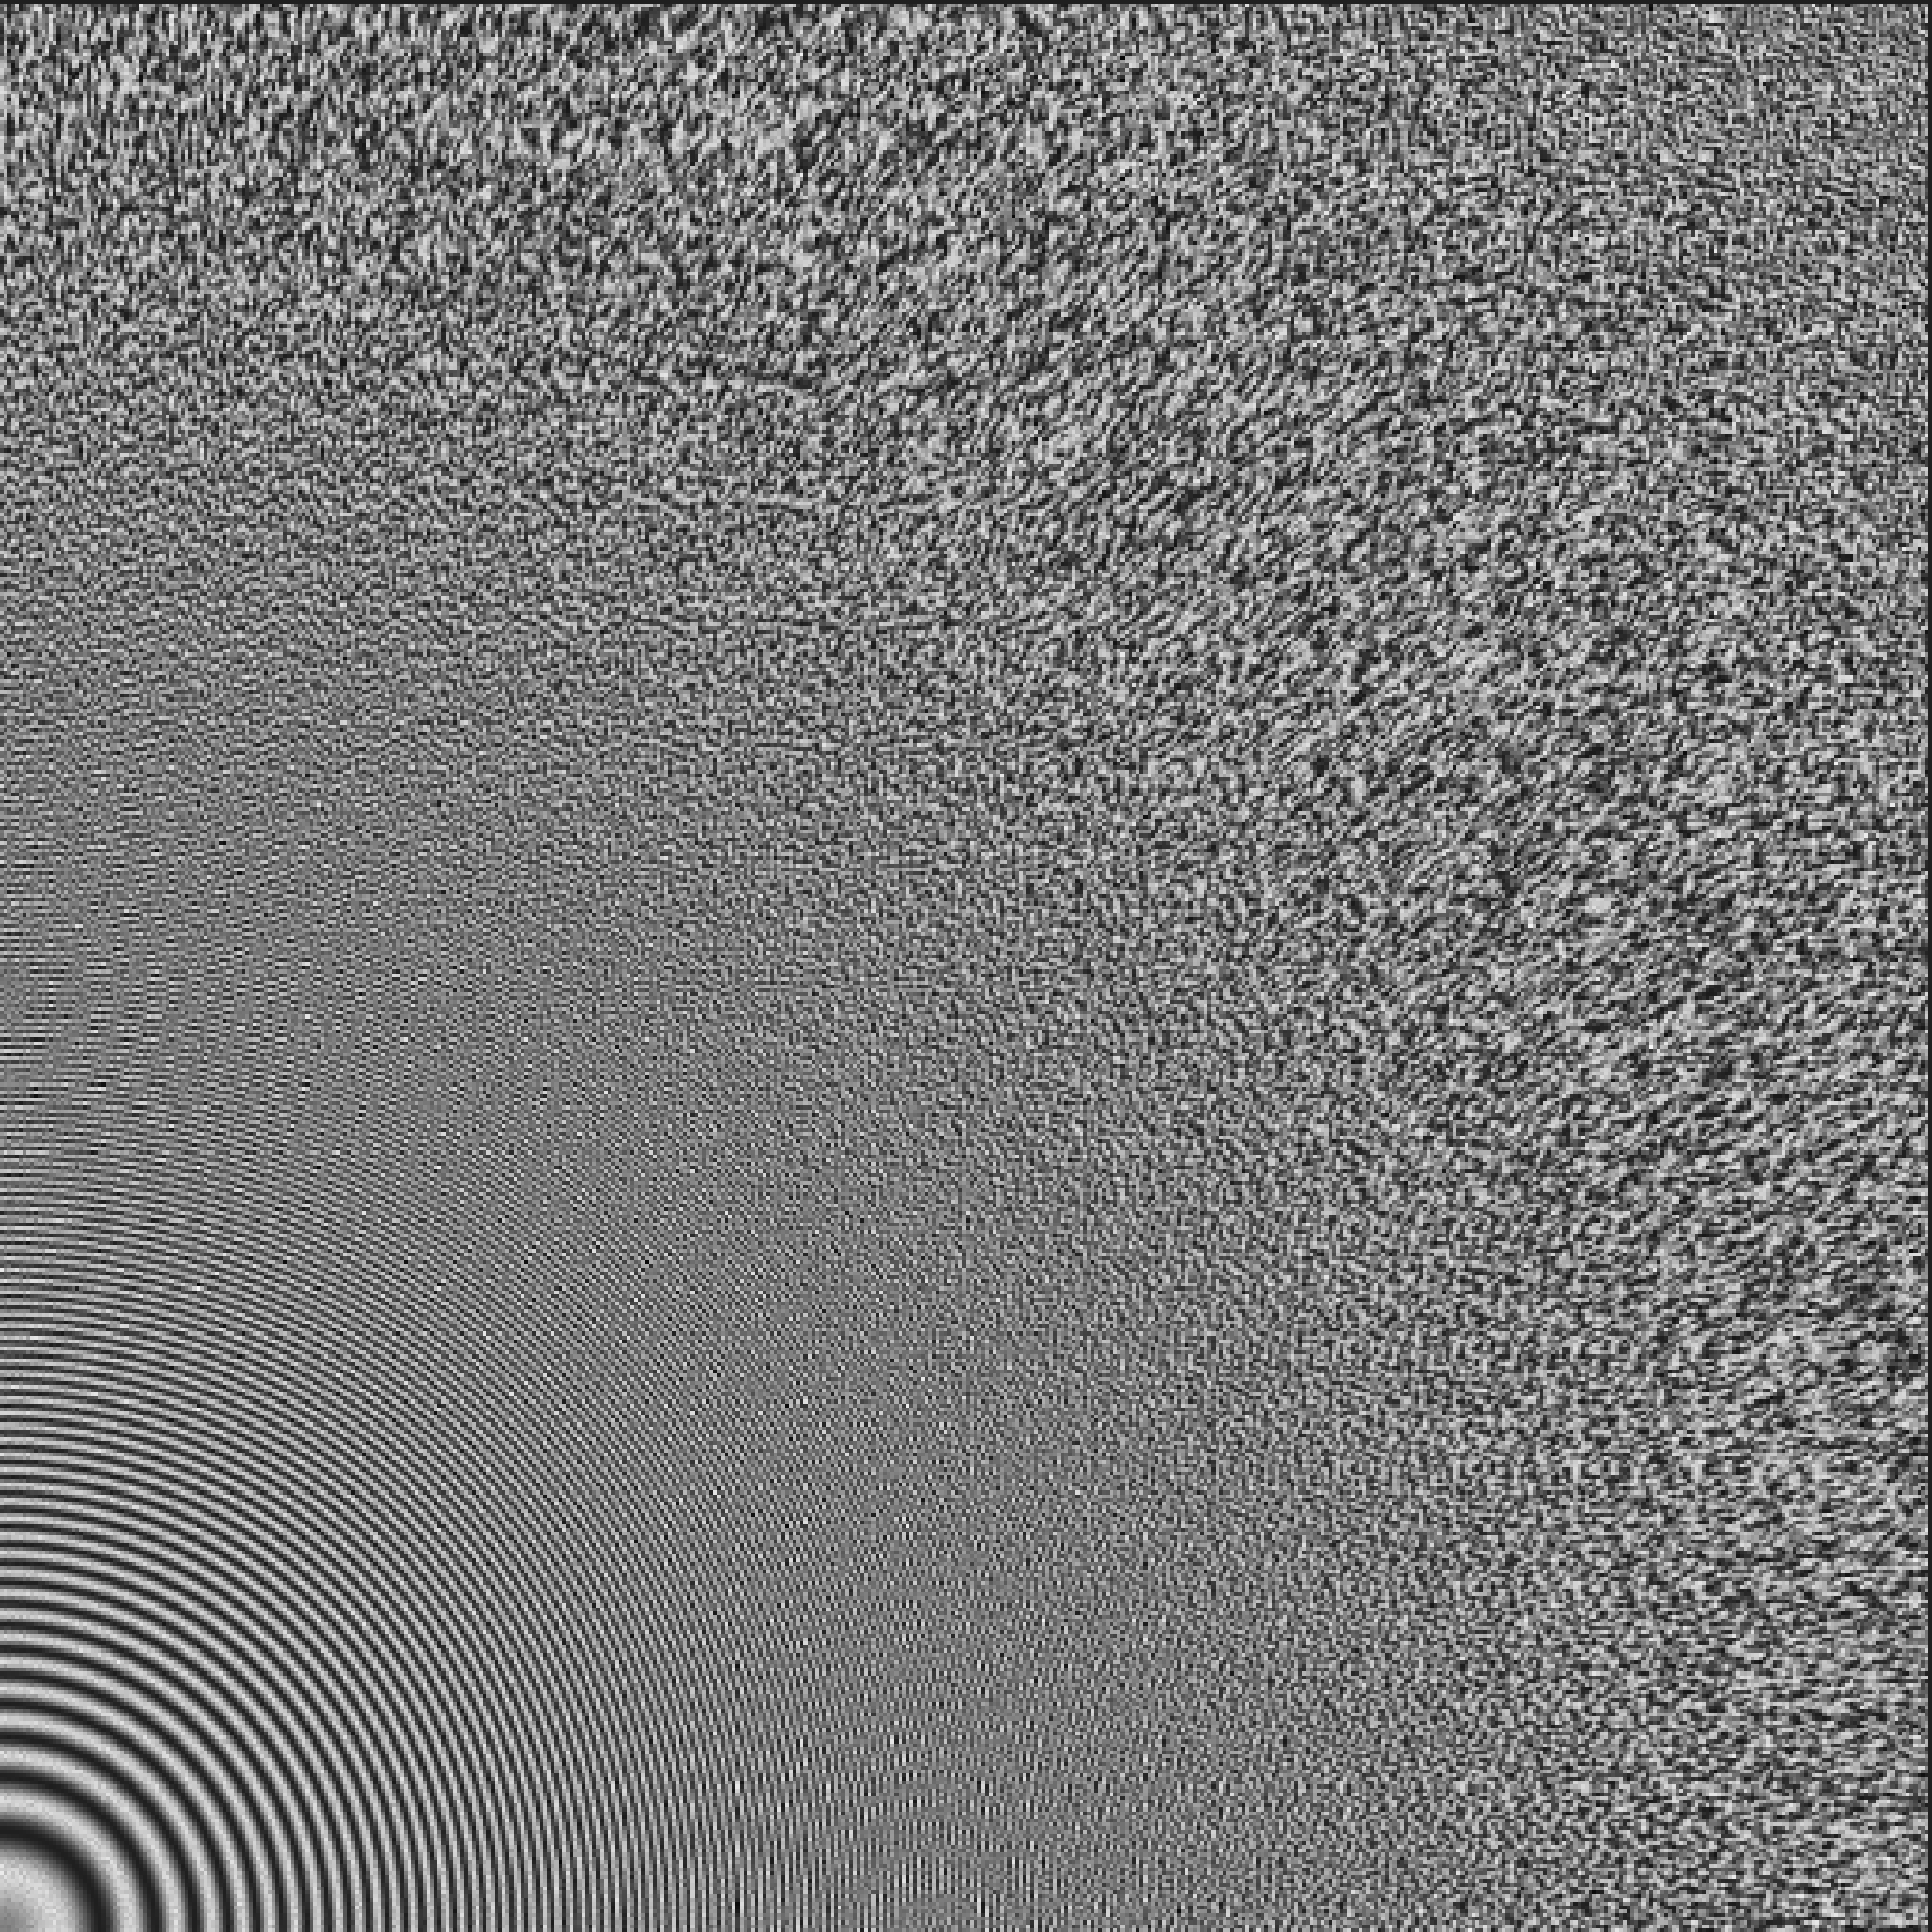
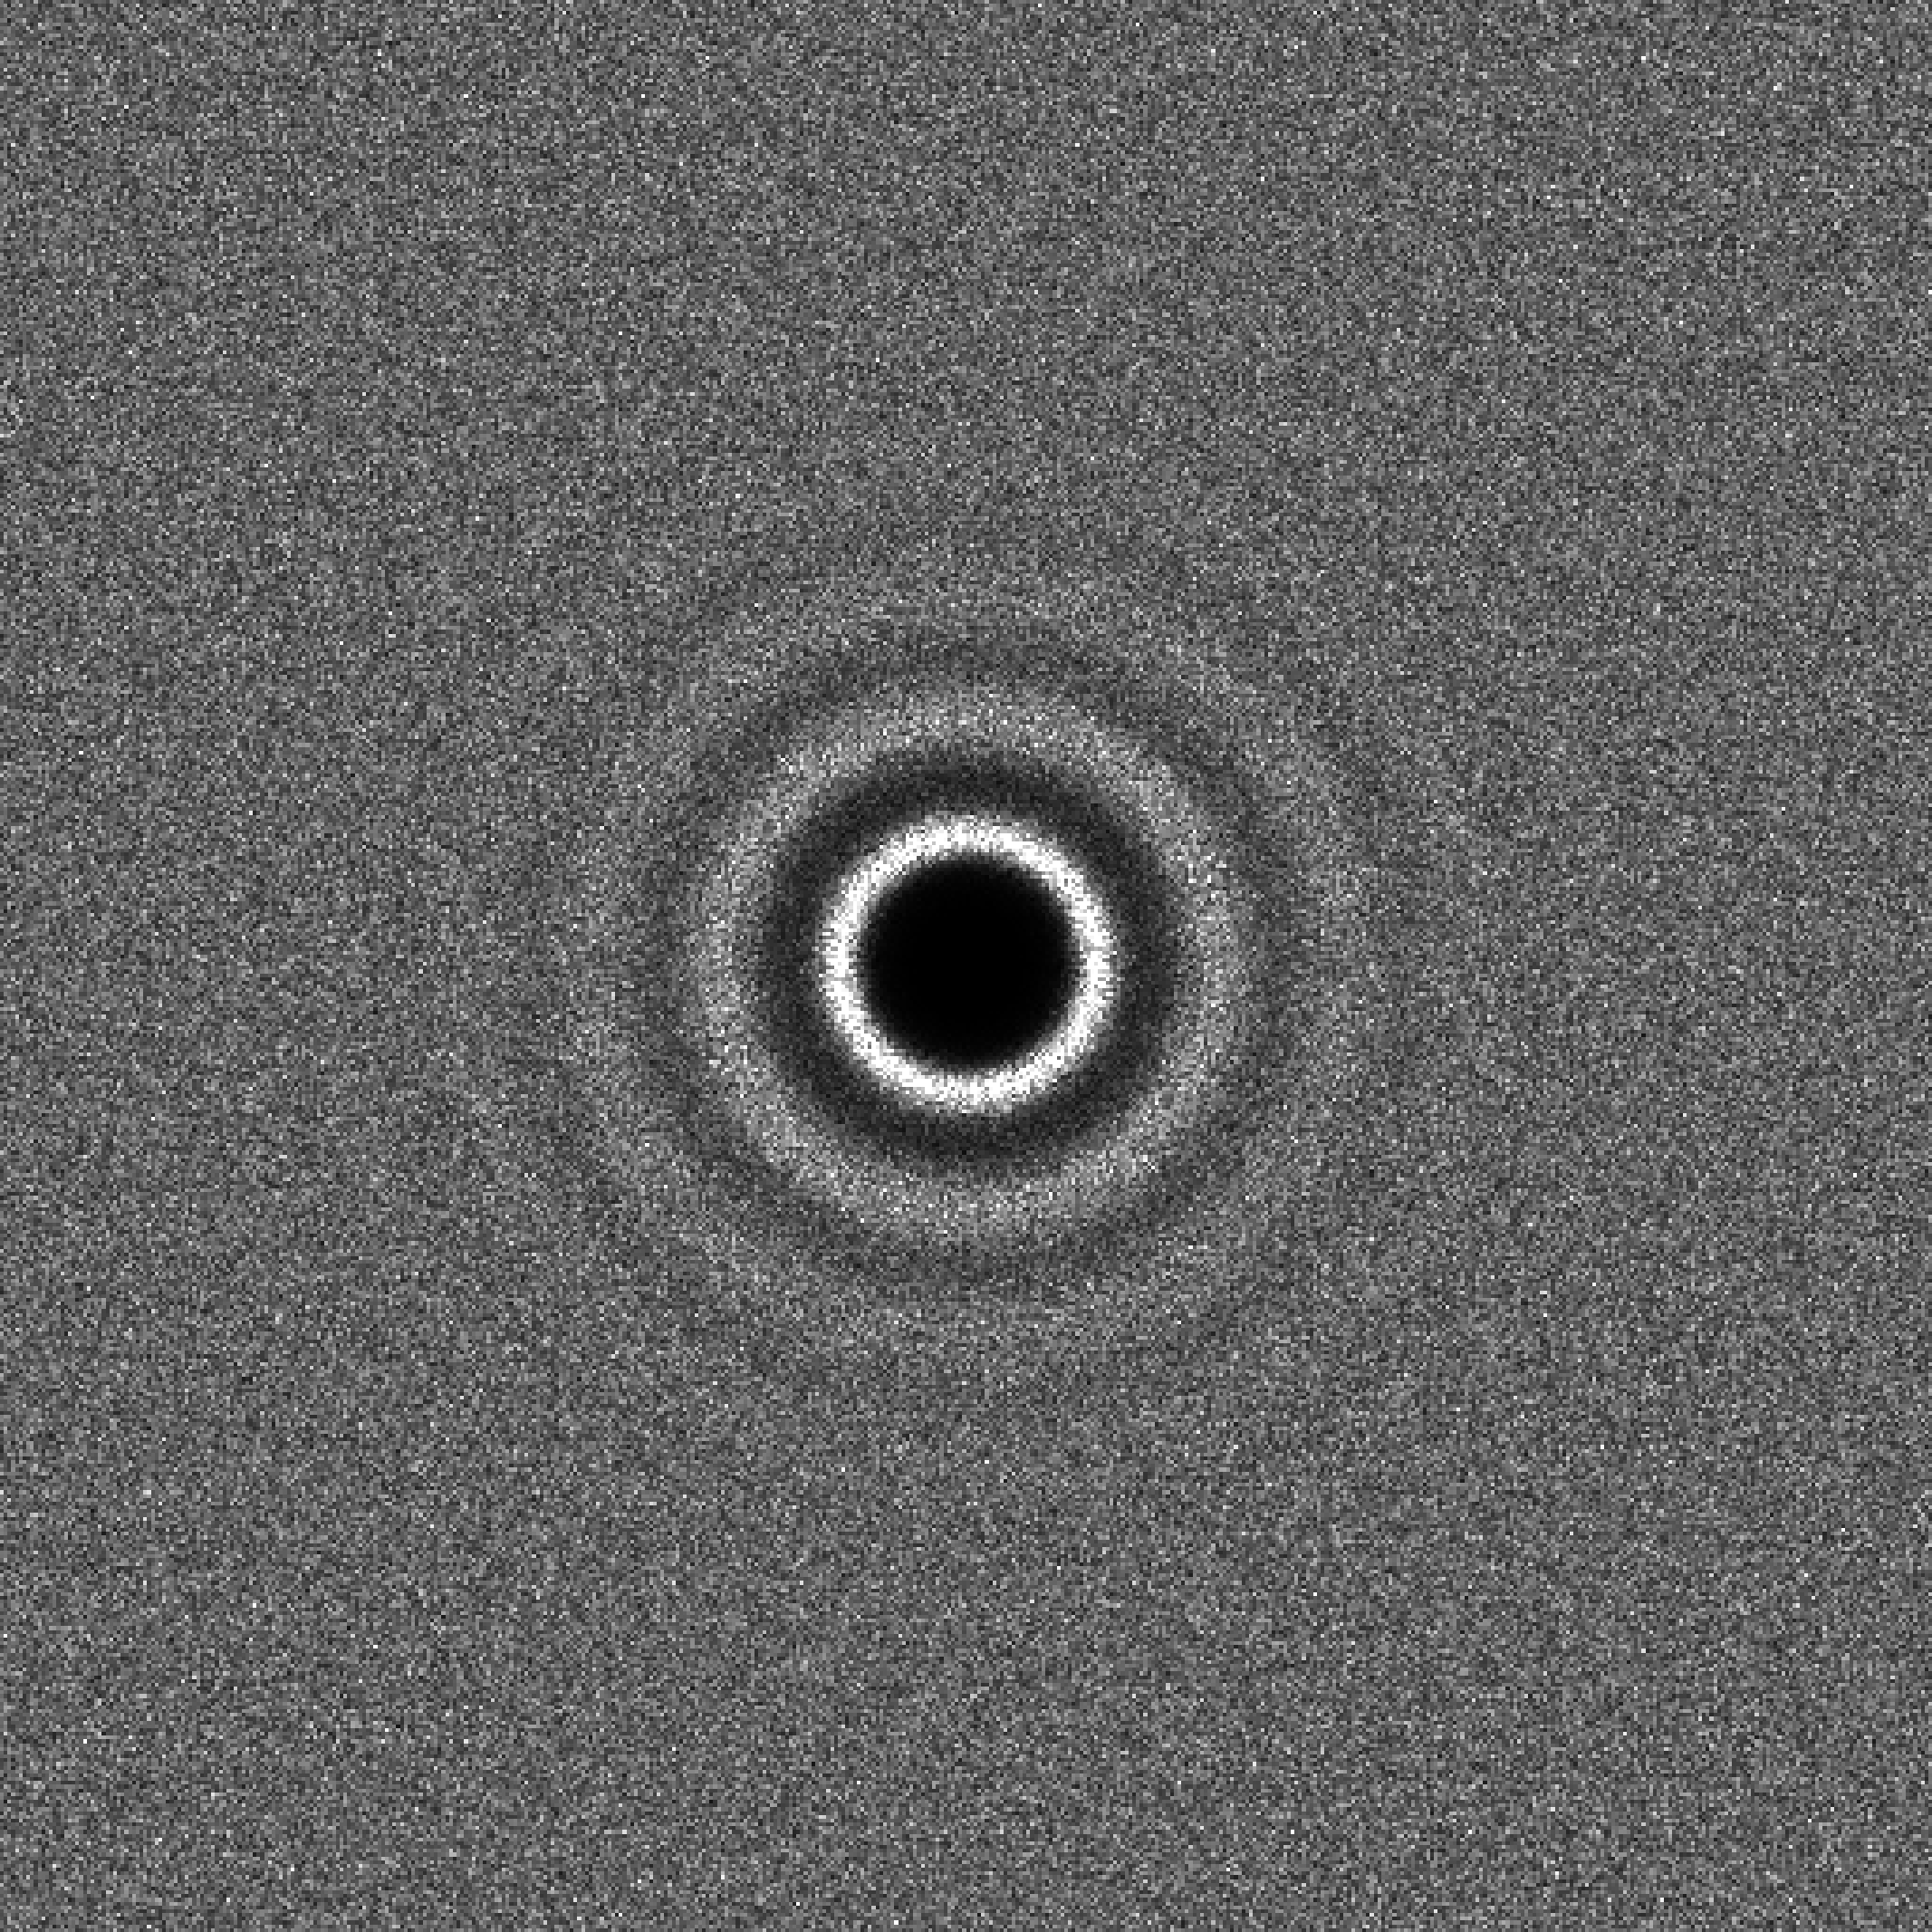
| (a) Visualization of gaps between white
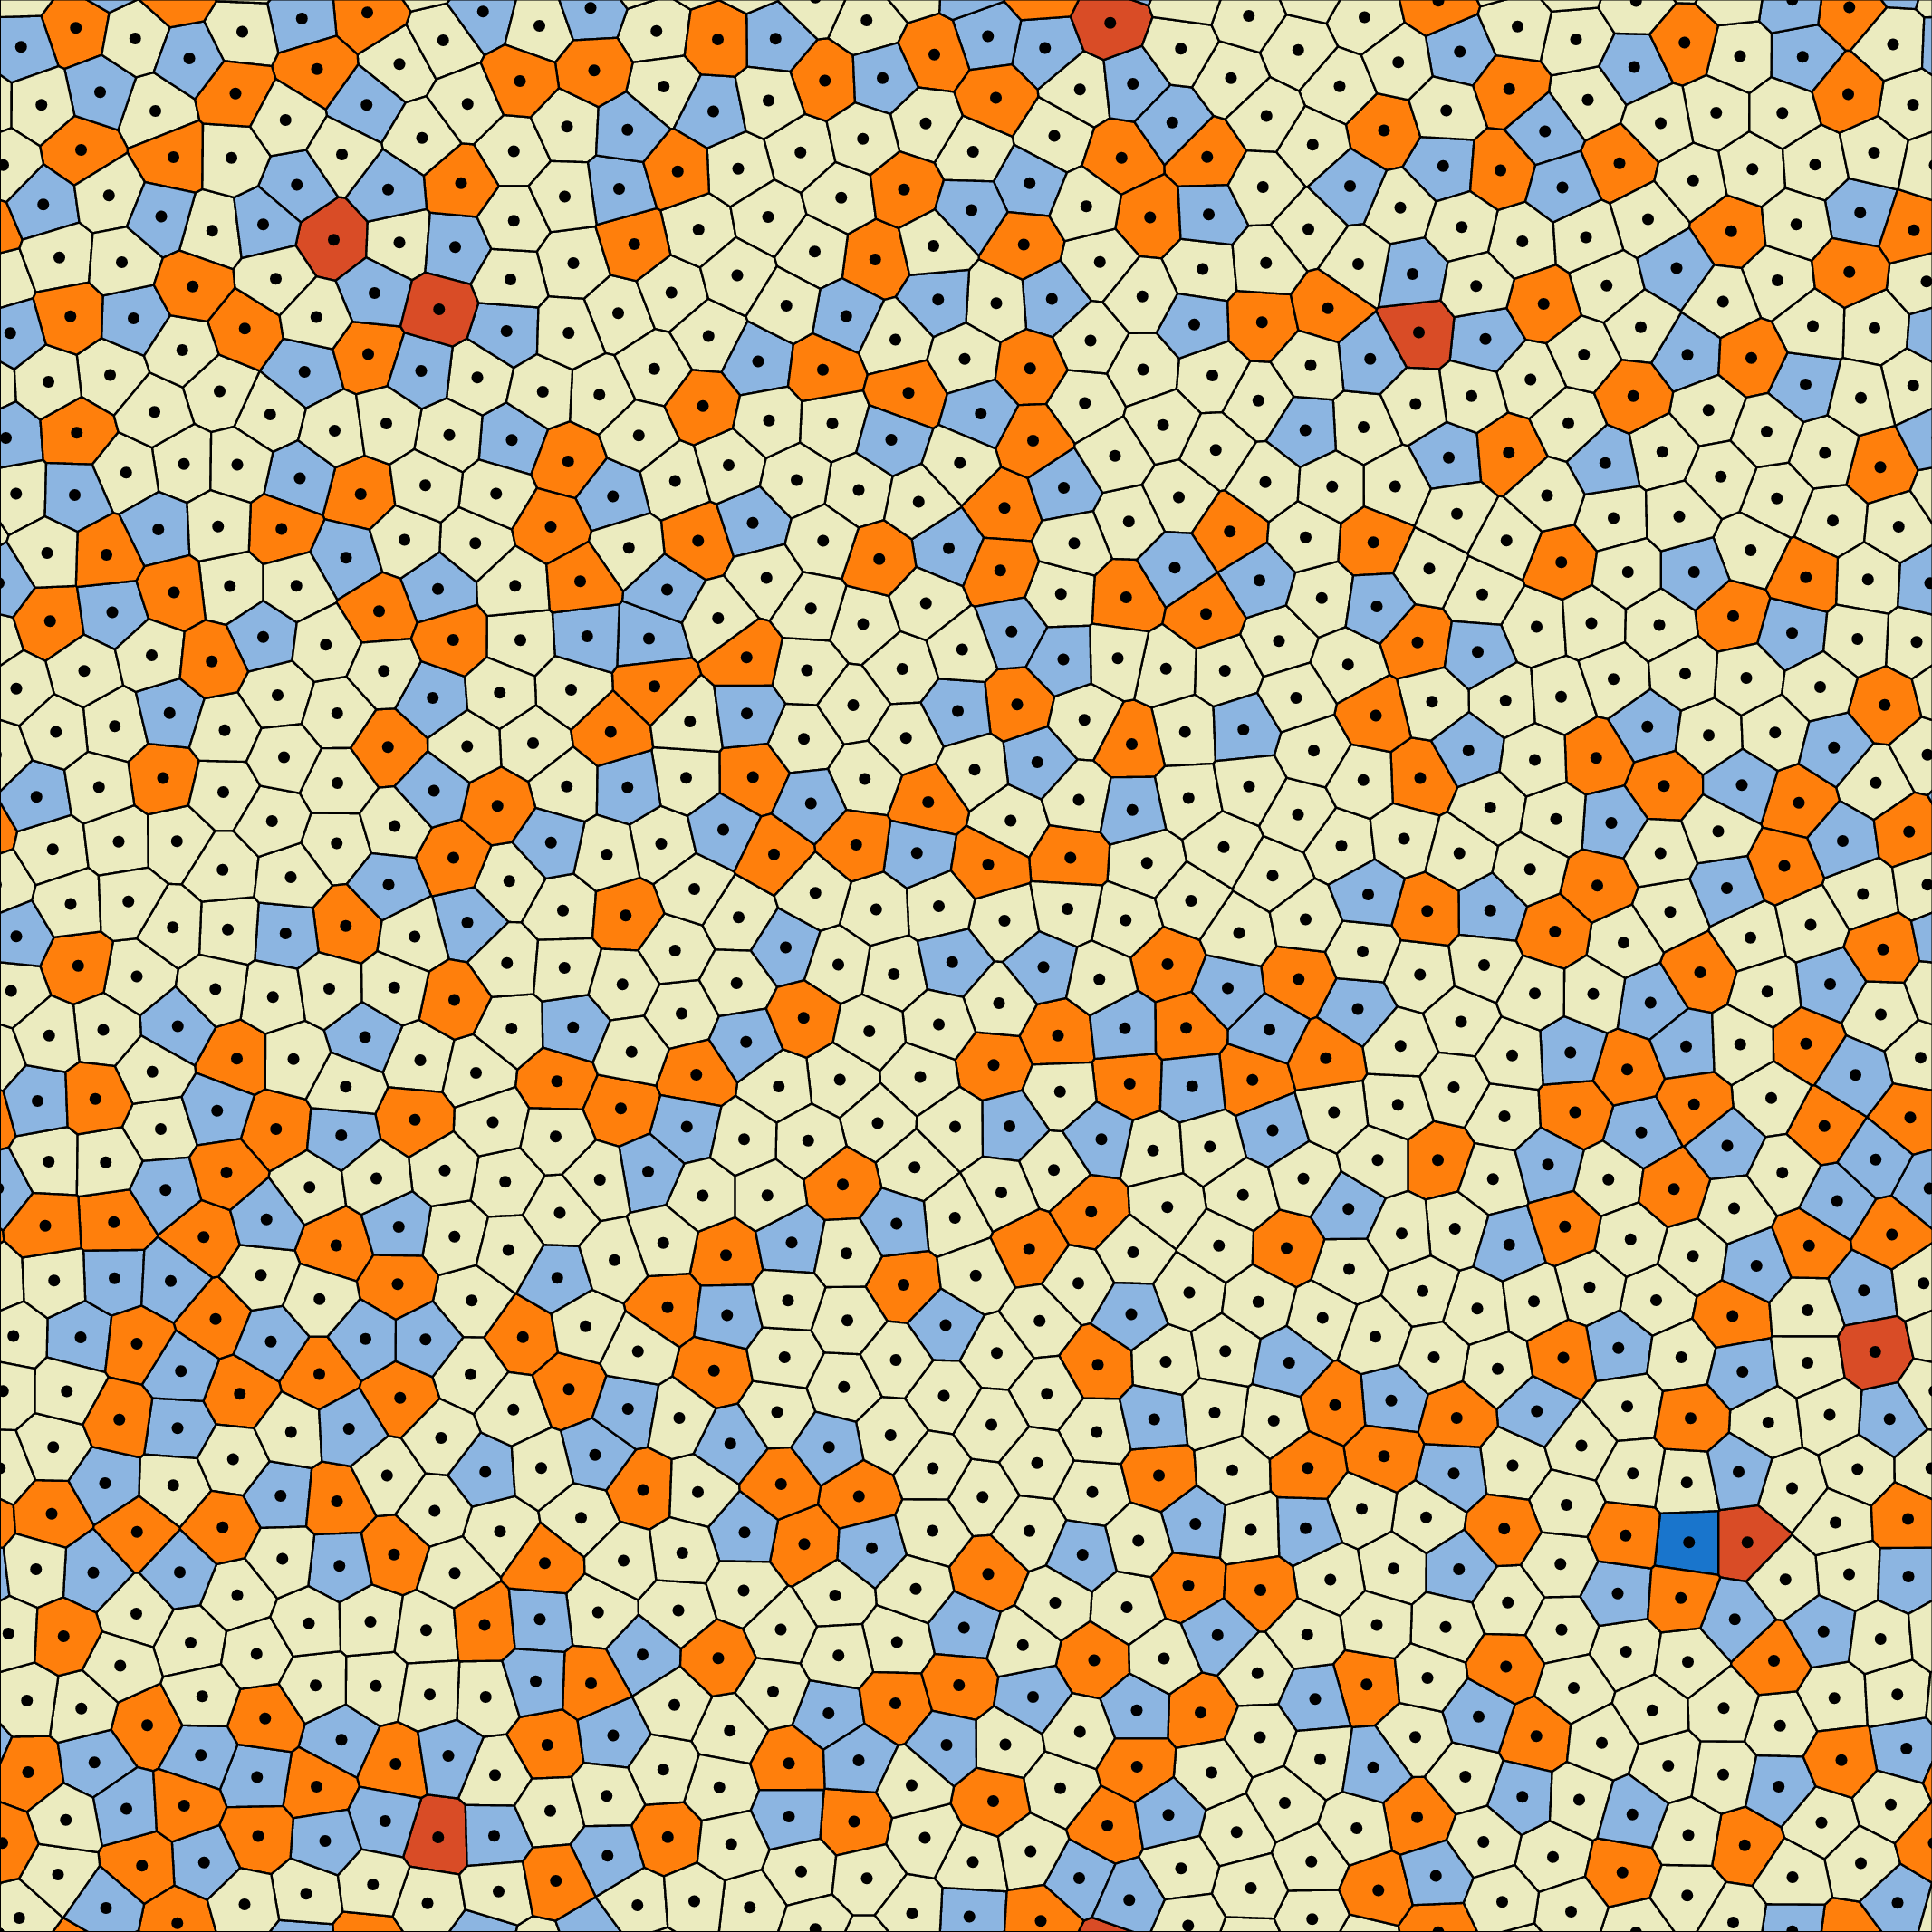
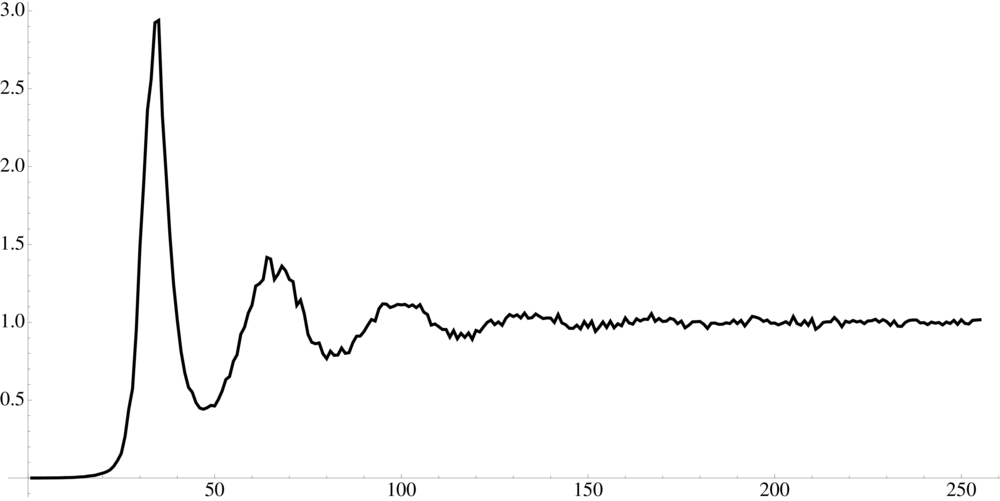
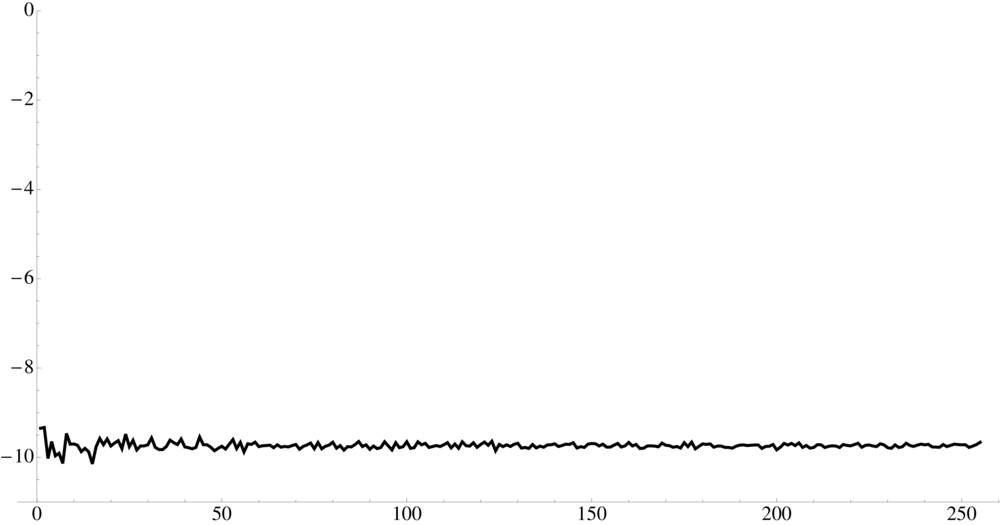
discs centered on sampling points. (b) Coloring based on the number of neighbors for the Voronoi region for each site. (c) Radial power spectra and anisotropy in dB (averaged over 10 point sets). (d) Zoneplate for the function sin(x² + y²). (e) Mean periodogram averaged for 10 point sets. |
||||
 |
 |
 |
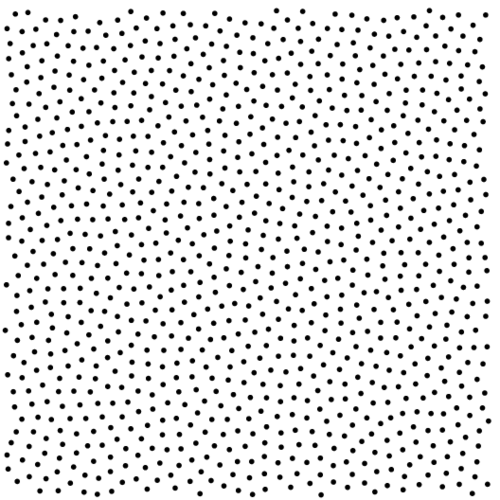 |
| Input 1 [EPS, DAT] | Result 1 [EPS, DAT] | Input 2 [EPS, DAT] | Result 2 [EPS, DAT] |
 |
 |
 |
 |
| Input 3 [EPS, DAT] | Result 3 [EPS, DAT] | Input 4 [EPS, DAT] | Result 4 [EPS, DAT] |
 |
 |
 |
 |
| Input 5 [EPS, DAT] | Result 6 [EPS, DAT] | Input 6 [ EPS, DAT] | Result 6 [EPS, DAT] |
 |
 |
 |
 |
| Input 7 [EPS, DAT] | Result 7 [EPS, DAT] | Input 8 [EPS, DAT] | Result 8 [EPS, DAT] |
 |
 |
 |
 |
| Input 9 [EPS, DAT] | Result 9 [EPS, DAT] | Input 10 [EPS, DAT] | Result 10 [EPS, DAT] |